Automating Monthly SEO Reports with Zapier and Airtable Interfaces
Let's be honest. Pulling together a monthly SEO report is the digital marketing equivalent of flossing. You know you should do it, but you'll find literally any excuse to put it off. It's a soul-sucking, copy-paste marathon. You're hopping between Google Analytics, Search Console, Ahrefs, and your client's CRM. You're manually screenshotting graphs that barely changed. By the time you're done, you're too exhausted to actually *think* about the data. Sound familiar? Good. That's why we're here to kill that process for good.
Your New Automation Cocktail: Zapier + Airtable

Here's the thing. You don't need a $10k/month enterprise dashboard. You need two tools that play nice together. Zapier is the nervous system—it moves data between apps automatically. Airtable is the brain and the pretty face—it stores the data in a flexible, spreadsheet-like base and lets you build killer interfaces to view it. This combo turns your chaotic data streams into a single, self-updating source of truth. No more begging the dev team for API access to build a custom dashboard.
Building Your Self-Updating SEO Base in Airtable
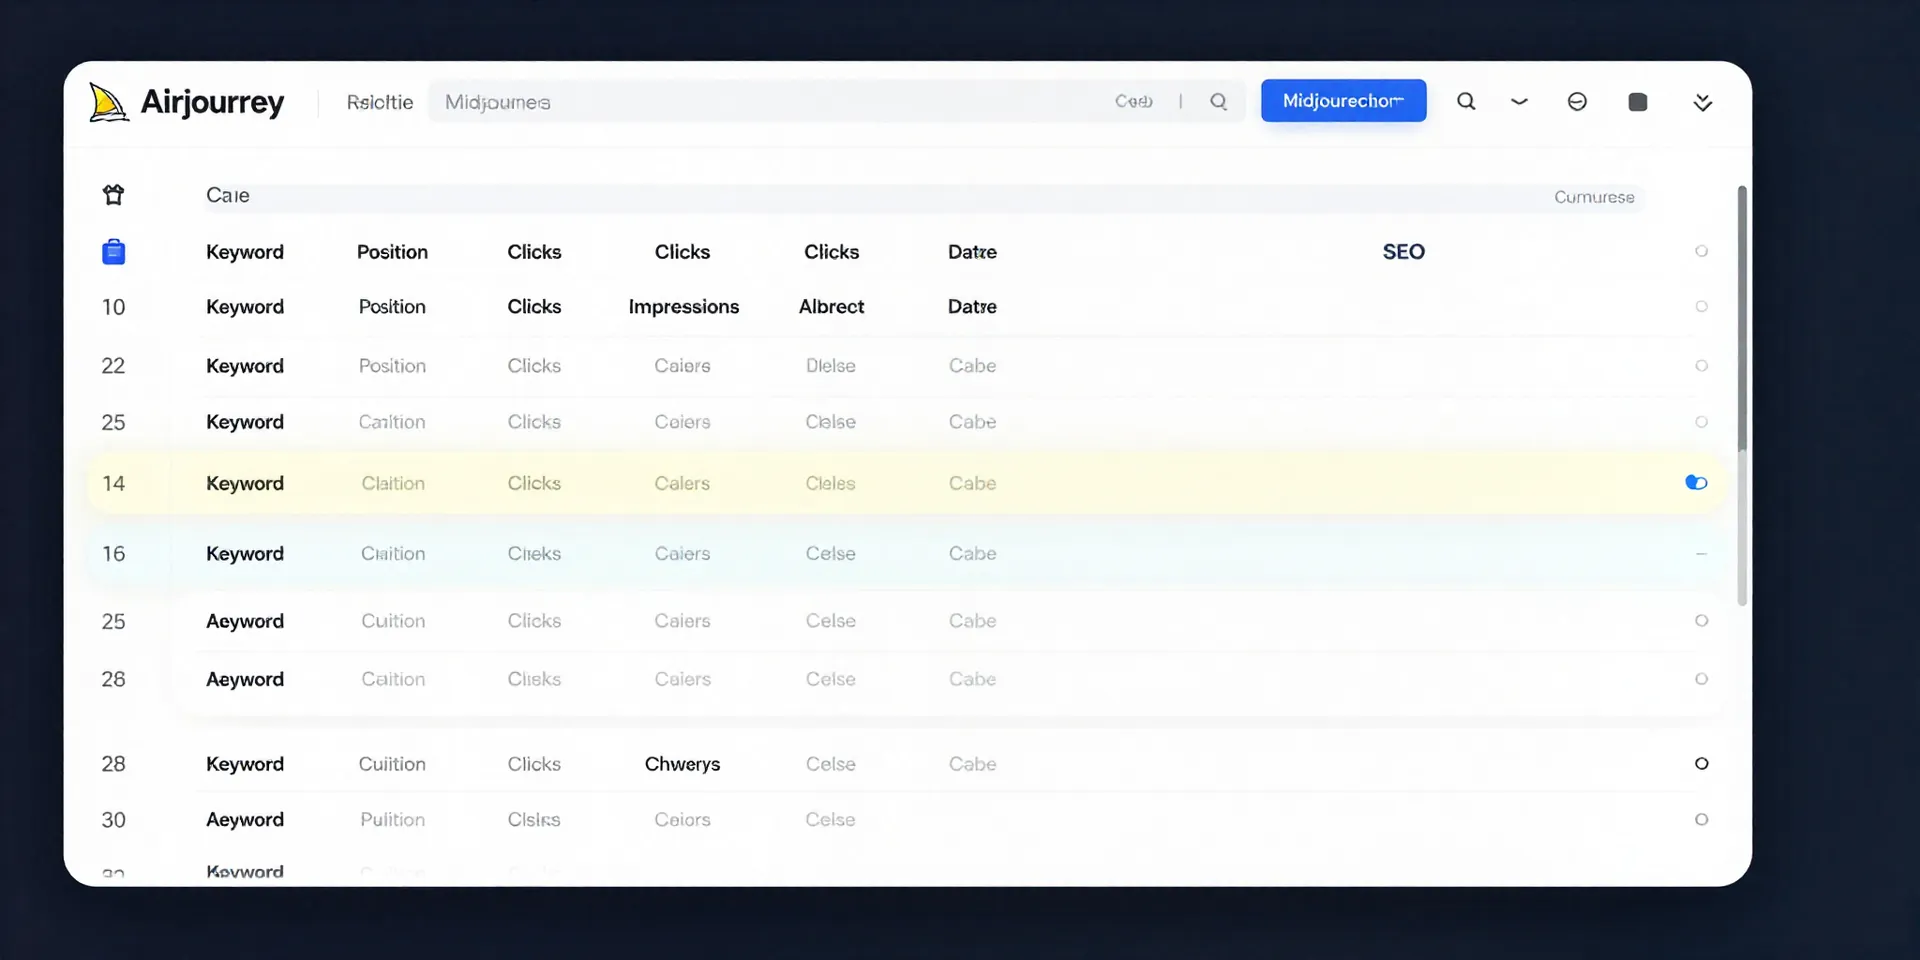
First, stop thinking "report." Start thinking "living record." In Airtable, create a base. Your core tables will be things like 'Keywords,' 'Pages,' and 'Monthly Snapshots.' The key is structure: a record for each keyword, linked to a specific page, with new rows for its performance each month. This isn't a static PDF. It's a database. Now you can filter, sort, and see trends over time with two clicks. This setup is your foundation. Everything else connects here.
Zapier: The Silent Robot That Does the Grunt Work
This is where the magic happens. You set up a "Zap." The trigger? A scheduled time—say, the 1st of every month. The actions? Zapier automatically fetches your key data from Google Search Console API, maybe your top 100 keywords by clicks. Then, it takes each row of that data and creates or updates a record in your Airtable 'Monthly Snapshots' table. You set it up once. It runs forever. You wake up on the 2nd of the month, and your report is already… done. Actually, it was never "done." It just *is*.
From Raw Data to Client-Ready Interface in 10 Minutes
Raw Airtable bases are powerful, but they can look like spreadsheets to clients. That's where Airtable Interfaces save the day. In about ten minutes, you can build a branded, read-only dashboard. Drag and drop components. A chart showing organic traffic trend. A list of top-performing pages this month. A gauge for average position. You share a single, beautiful link. The data behind it is always current. Your client gets insight, not overwhelm. You get to be the hero who provides clarity, not just data.
What You Win Back (Hint: It's Your Sanity)
So what does this automation actually buy you? Time, obviously. But more importantly, mental bandwidth. You're no longer a data-entry clerk. You're an analyst. You can look at the trends your automated system surfaces and ask, "Why did *this* page jump?" or "What can we learn from *that* keyword's drop?" You move from reactive reporting to proactive strategy. The boring, repetitive part runs on autopilot. You get to do the interesting work.